April's new features for Copy Trading, released!

The social trading squad continues to innovate and improve, and has recently introduced six significant features to enhance its copy trading product, with many more planned for release in the upcoming weeks. The current six features launched include:
- Trader's Data Indicator Split
- Inconsistent position/copy trading data explanation
- Copy trading entrance point optimization
- Proportional Copy Trading
- Copy traders will automatically unfollow lead traders after 20 failed consecutive trades
- Copy Trader FAQ Module
More details on each of the following features are as follows:
1. Clearer Trading Data

a) The PnL of the lead trader will now exclusively reflect the performance of lead orders, rather than including all transactions.
- Previously, the method for determining a lead trader's PnL% and total PnL relied on the overall trading account data, which involved using a snapshot value of the account's assets at different time periods. The formula used was: Lead trade total PnL = Assets at end of calculation period - Assets at start of calculation period - Assets transferred in + Assets transferred out.
However, this approach resulted in the inclusion of data from non-lead contract trading, spot trading, bot trading, and option trading in the PnL calculations, making it difficult to specifically measure lead trade data. To address this issue, we have optimized our calculation methods as follows:
| Metric | Previous calculation method | New calculation method |
|---|---|---|
| Lead trade total PnL | Lead trade total PnL = Assets at end of calculation period - Assets at start of calculation period - Assets transferred in + Assets transferred out | Lead trade PnL = Sum (Profit and loss of all lead trade orders closed during the calculation period) |
| Lead trade PnL% | Lead trade PnL% = Lead trade total PnL / Investment during period | Lead trade PnL% = New lead trader total PnL / Investment during period |
b) The displayed data for the copy or lead trader usually only includes successfully created lead trades using the selected lead trade contracts, rather than all contract trades.
- Previously, the win rate, profit/loss ratio, gainers/losers, and average holding period metrics on the lead trader profile were only calculated based on data from successful lead trade orders. However, if an order triggered risk control — for example, because a lead trader has less than 500 USDT in their trading account— it wouldn't be included in the data, which prevented the metrics from giving an accurate measure of a lead trader's trading ability.
Moving forward, any contract trades that utilize a lead trader's selected lead trade contracts will be included in the data for these metrics, regardless of whether they successfully become lead trades or not. The formula for calculation remains unchanged, but the data source has been expanded to include these additional contract trades.
| Previous data source | New data source |
|---|---|
| Contract trades that were successfully created as lead trades | All contract trades which use the lead trader's selected lead trade contracts |
c) Optimized the calculation of the investment value used to calculate PnL%
- Under our previous calculation method, the amount you transferred into your trading account each day was included in the calculation of your overall investment at the start of the investment period.
However, with our new calculation method, if the amount you transfer each day is lower than the cumulative net amount transferred out from the previous day, it will not be added to your overall investment. On the other hand, if the amount you transfer in is higher than the previous day's cumulative net amount transferred out, the difference between the two will be added to the previous day's overall investment.
As a result of this optimization, a lead trader's overall investment value may decrease, while the PnL% (profit/loss percentage) may increase. This can also impact a lead trader's PnL curves, reflecting the changes in the calculation method.
You can view the table below to better understand how the calculation methods differ.
| Day | Action | Assets at start of day | Assets at end of day | Transferred in | Cumulative net transferred out | Investment (Updated calculation method) | Investment (Previous calculation method) | Cumulative PnL | PnL% (Updated calculation method) | PnL% (Previous calculation method) |
|---|---|---|---|---|---|---|---|---|---|---|
| 1 | None | 10,000 | 12,000 | 0 | 0 | 10,000 | 10,000 | 2000 | 20% | 20% |
| 2 | Transfer in 3000 | 12,000 | 15,000 | 3000 | 0 | 13,000 | 13,000 | 2000 | 2000/13,000 = 15.38% | 15.38% |
| 3 | Transfer out 5000 | 15,000 | 10,000 | 0 | 5000 | 13,000 | 13,000 | 2000 | 2000/13,000 = 15.38% | 15.38% |
| 4 | Transfer in 4000 | 10,000 | 14,000 | 4000 | 1000 | 13,000 | 17,000 | 2000 | 2000/17,000 = 11.7% | 11.7% |
| 5 | Transfer out 5000 | 14,000 | 9000 | 0 | 6000 | 13,000 | 17,000 | 2000 | 2000/17,000 = 11.7% | 11.7% |
| 6 | Transfer in 20,000 | 5000 | 25,000 | 20,000 | 0 | 27,000 | 37,000 | 2000 | 2000/27,000 = 7.4% | 7.4% |
2. Inconsistent position/copy trading data explanation

When a copy or lead trader initiates trading, they can view information such as profit and loss (PnL) and position open price on both the manual trading page and the copy trade management page. However, there may be discrepancies in the data displayed on these pages due to the fact that the manual trading page consolidates data for all orders under one position, whereas the copy trading page presents data for each individual order separately. Read more.
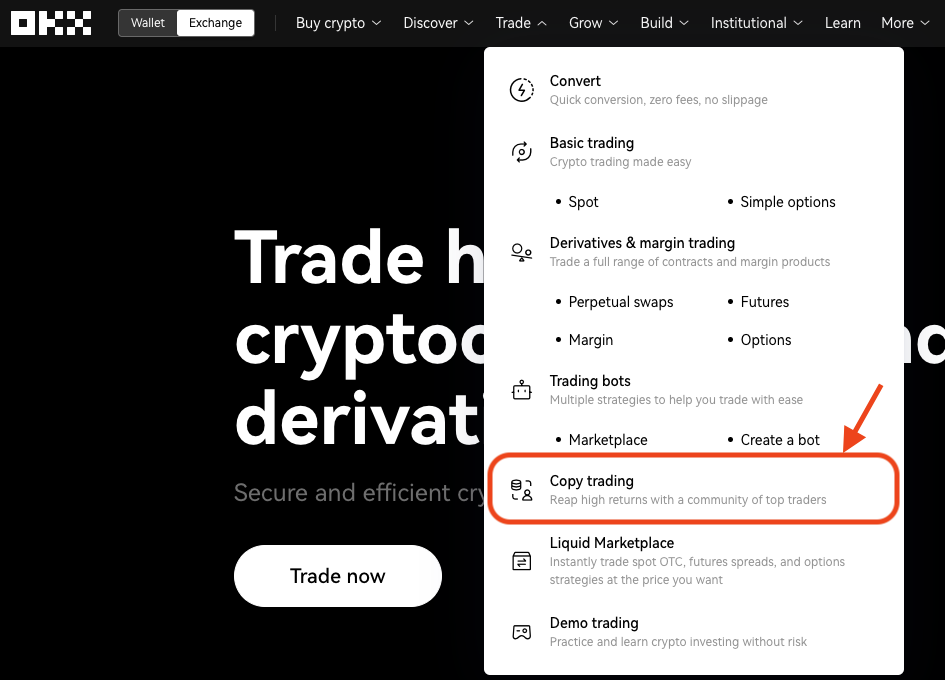
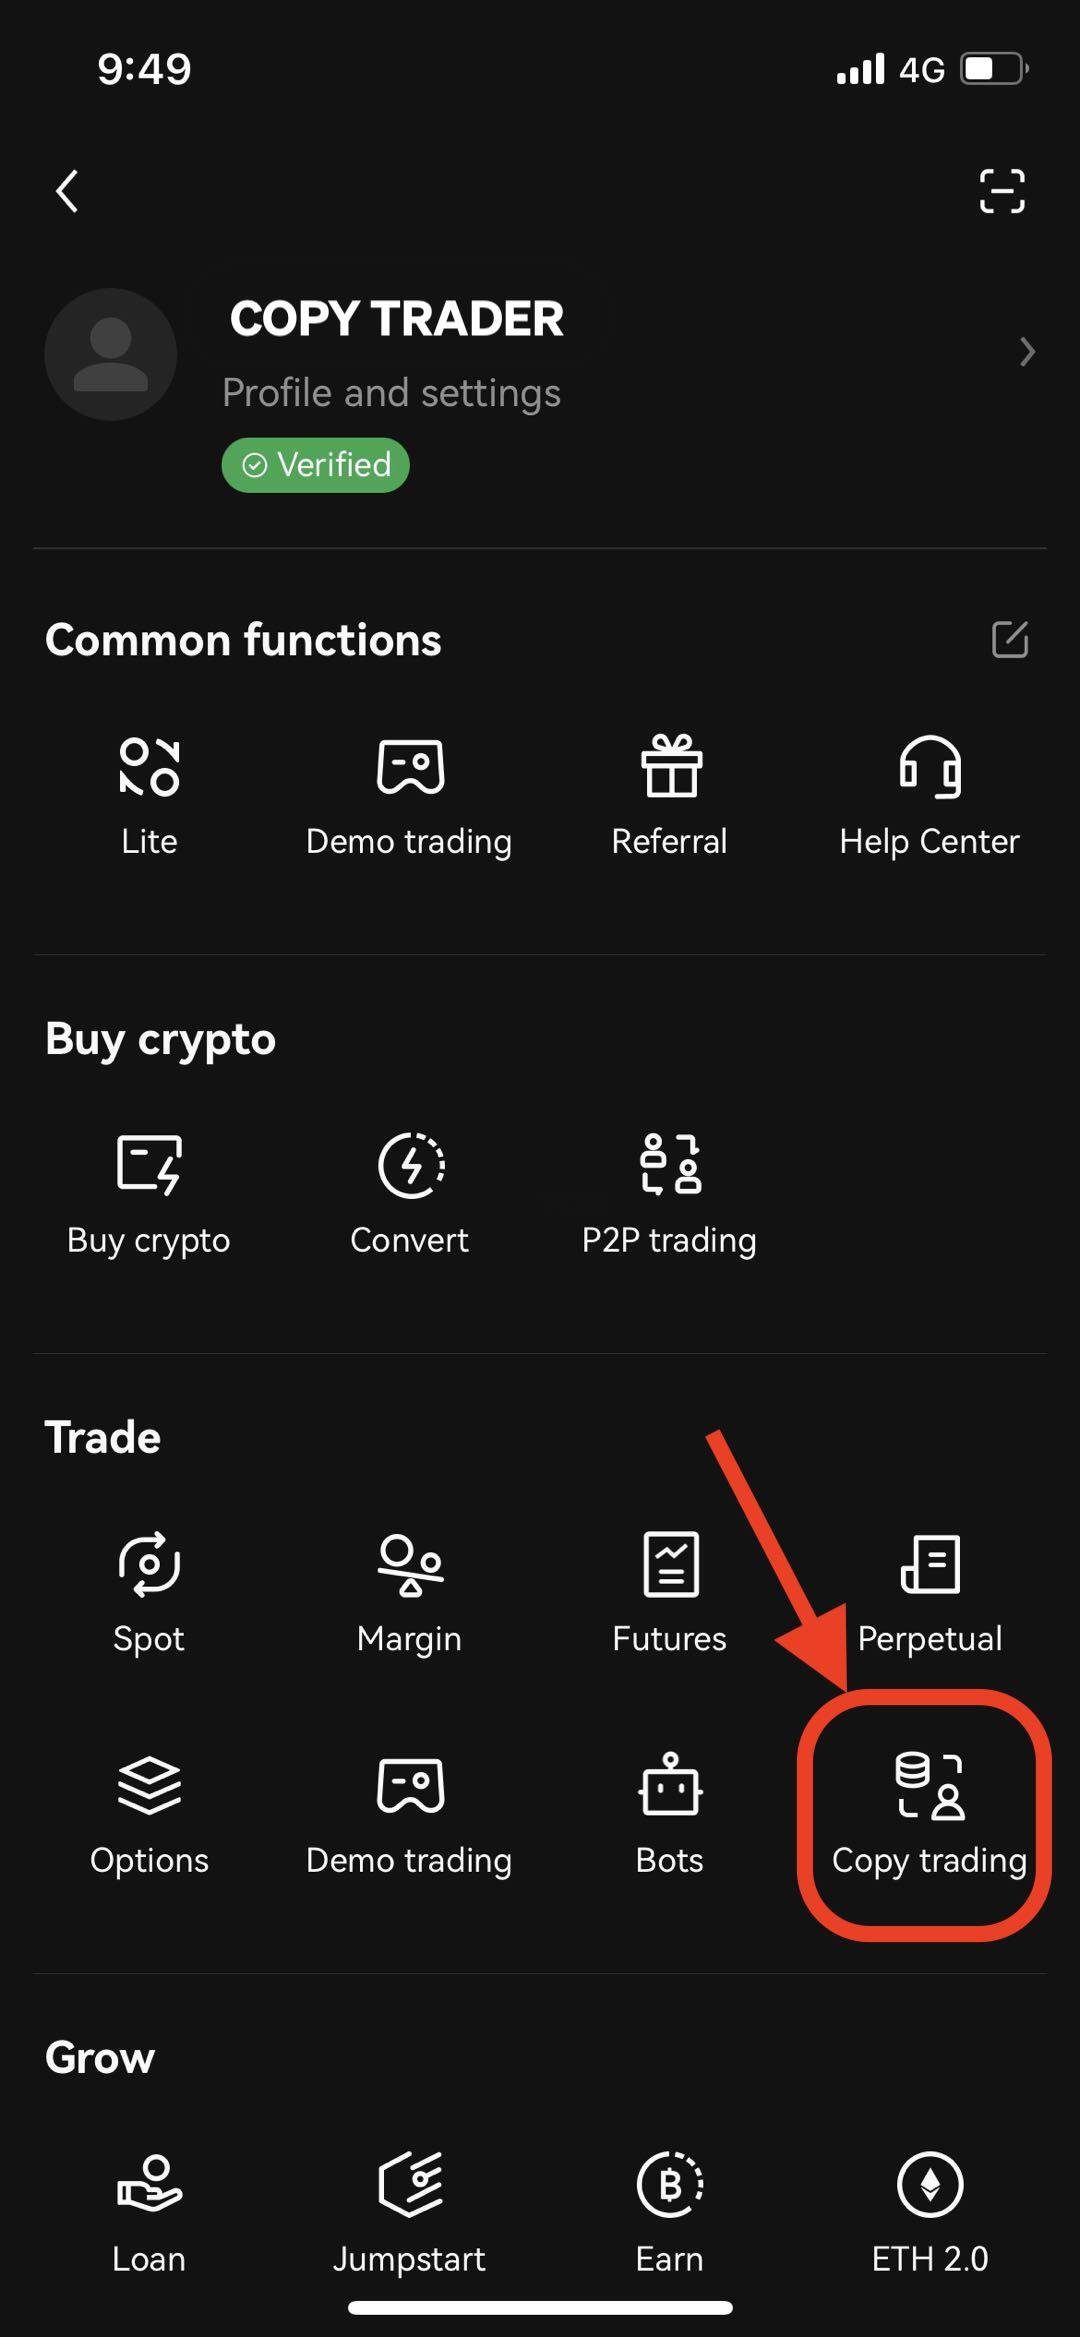
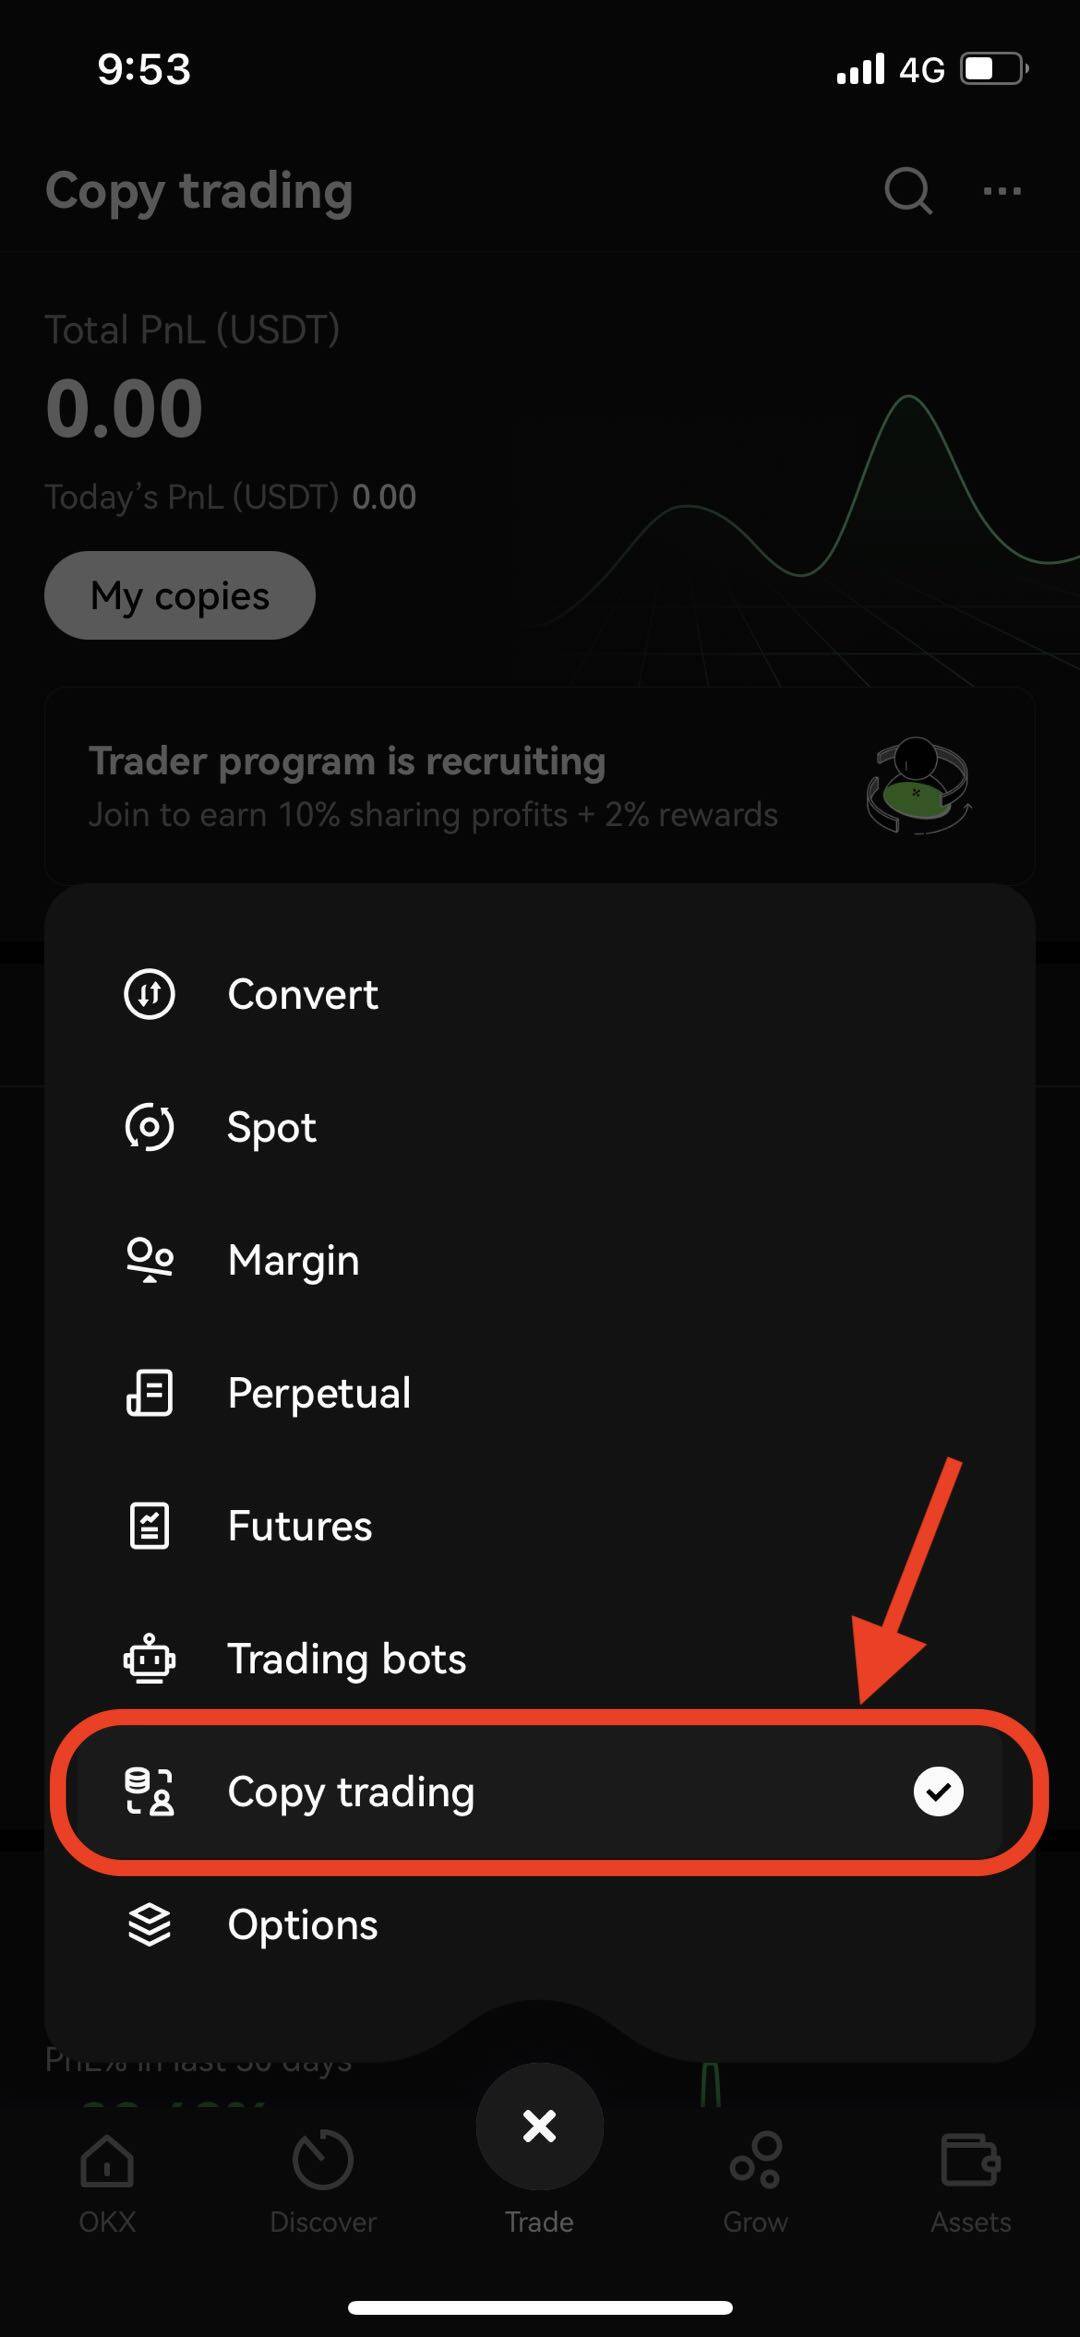
3. Copy trading entrance point optimization

We have added 3 new entry points for faster access and better visibility towards our copy trading product. You can navigate to our copy trading page via:
Under the trade menu in the Web Header

App Homepage Personal Center

App trade Tab

4. Proportional Copy trading

In proportional copy trading, every time a trader opens a position, the amount of money a copy trader invests is proportional to the Master trader's position. E.g. If your proportional copy is set to 0.1X, and the trader opens a 10,000 USDT value positioning, you will open a positioning of 10,000 USDT * 0.1 = 1,000 USDT value.
This allows for more trades of varying contract sizes to be followed, catering to a wider group of copy traders/investors with varying risk appetite and capital and helps to potentially enhance a trader's portfolio diversification with the ability to now follow a wider variety of trades, of varying contract sizes.
5. Copy traders will automatically be removed from copy list after 20 failed consecutive trades

To ensure active copy trading participation for our Lead Traders and fairness on vacancy for other potential copy traders, copy traders with more than 20 failed consecutive trades will be automatically removed from the copy list of the lead trader.
In this event, we have implemented a 3-tiered reminder system that prompts you to take necessary actions to prevent future copy trade failures:
a) When copy traders fail to copy 15 consecutive trades
b) When copy traders have fulfilled all conditions to stop copying and the 3 day countdown begins
c) When copy traders automatically cease copying.
This removal criteria will apply only to copy traders who are following a lead trader with max capacity of copy traders, and do not have an existing position with the lead trader.
6. Copy Trader FAQ Module

We have made enhancements to the interface of our FAQ module with the aim of assisting you in finding answers to your questions. We acknowledge that this is an ongoing feature that will continuously evolve as we add and update its contents. We welcome any ideas or feedback from you on how we can further improve it. Please feel free to reach out to us with your suggestions!


